.png)
Role
UX Designer
1 Designer
8 Weeks
Responsibilities
Product Design
Product Management
Strategic Thinking
The ocean is the largest ecosystem on the planet, making it one of the most urgent sustainable goals to address. It impacts everyone and everything on the planet, from providing 55 million tons of harvest a year to regulating global climate. According to the United Nations annually over 17 million tons of plastic are polluted into our marine systems. My target audience, college students, rely on the ocean as a food source, recreational activity, and regulation of their day-to-day climate. How might we reduce plastic waste in our ocean systems and encourage college students to reduce, reuse, and recycle.
.png)
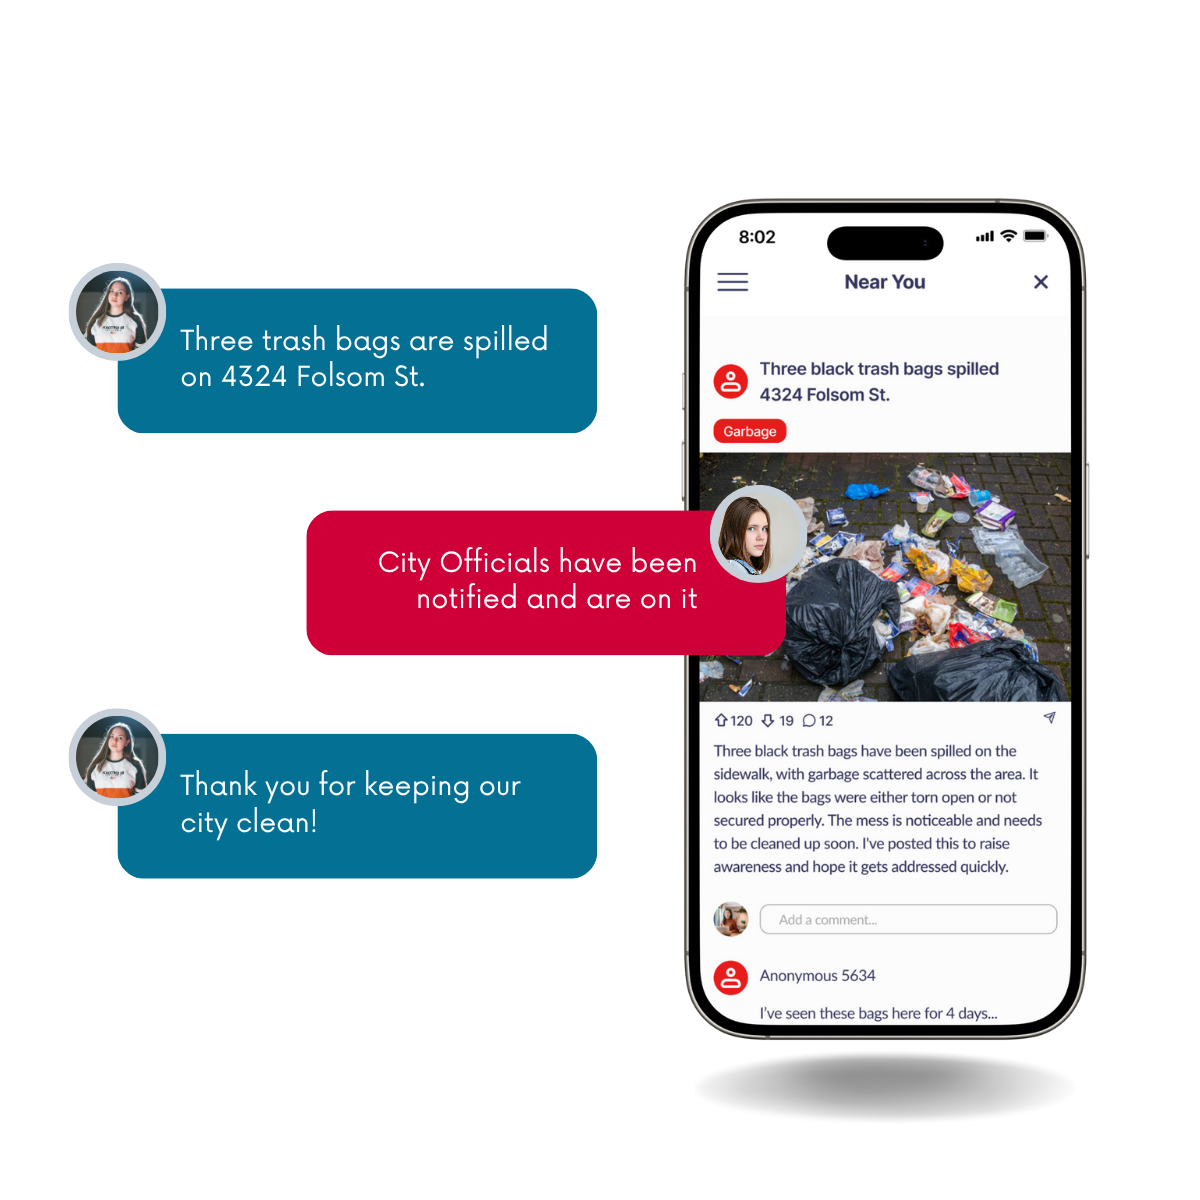
RecycLens is an augmented reality (AR) mobile app designed to help college students tackle ocean plastic pollution by making recycling simple, engaging, and rewarding. Aligned with UN Sustainable Development Goal 14 (SDG Life Below Water), the app addresses the growing issue of marine plastic waste by targeting a user group that cares about environmental impact but often finds recycling confusing or inconvenient.
Using AR technology, RecycLens allows users to instantly scan and identify different types of waste, guiding them on proper disposal. To encourage lasting behavior change, it gamifies the recycling process through points, rankings, and progress tracking, turning everyday recycling into a competitive and socially engaging experience.
Our goals focused on sustainability and using AR technology to align with United Nations SDG 14
Users will:
→ Easily identify different trash types
→ Recycle without confusion
→ Feel informed about recycling decisions
→ Contribute to a cleaner environment
→ Feel engaged and motivated through gamification
→ Track personal impact
Measured By:
→ Amount of trash recycled through app
→ How informed users were with type of trash
→ Users noting feeling better about their contribution
RecycLens will:
→ Support United nations SDG 14
→ Simplify recycling
→ Increase Customer Retention
→ Improve Brand Image
Measured By:
→ Amount of trash recycled
→ New users onboarded in app
→ DAU/MAU/YAU
→ Customer satisfaction by reviews
My objective for conducting research was to understand the severity of plastic pollution in ocean systems. It was important to me that the problem was substantial and to gauge how interested my target audience, Hayward students, were in the sustainability of aquatic life.
I looked through secondary resources, conducted user interviews, user testing on how much Haywards students knew about what was and wasn't recyclable, and did user testing for my product.
.png)
Students care about ocean pollution
College students expressed concern about plastic waste harming marine life and the environment, showing emotional investment in sustainability issues.
Recycling feels overwhelming
Users described recycling as "too much work" or "too hard," particularly due to confusion about what items are recyclable, leading to inaction despite good intentions.
Trash identification is inconsistent
In a test where participants categorized items as trash, organic, or recyclable, scores ranged from 5/9 to 9/9, revealing varying levels of recycling knowledge and a need for educational support.
Gamification boosts motivation
Users responded positively to the point system and leaderboard, stating that these features made recycling feel fun, competitive, and worth continuing.
To test how well students could identify different types of trash, I created an exercise using nine different trash items. I asked three college students to label each item as “T” for trash, “R” for recyclable, or “O” for organic. One participant scored a perfect 9 out of 9, another scored 8 out of 9, but one participant only got 5 correct. This wide range in results showed me that while some students have a solid understanding of trash sorting, others struggle. This test confirmed that a tool like RecycLens could be really useful in helping users identify and properly dispose of waste.
.png)
When [Hayward college students] who [feel disgust by trash in oceans] want to [reduce trash that enters ocean systems], they will use [RecycLens, an AR app that helps users identify the type of trash they have], measured by [increased knowledge of type of trash].
When [Hayward college students] who [worry for marine life] want to [reduce trash that enters ocean systems], they will use [RecycLens, an AR app that helps users identify the type of trash they have], measured by [increased recycling].
Sarah is a 21-year-old student at CSU East Bay who loves visiting the ocean and deeply cares about environmental health. While she understands the importance of recycling, she often avoids it because identifying the type of trash she has feels confusing and time-consuming. When she discovers RecycLens, she’s initially frustrated about needing to create an account, but becomes excited once she sees how the app uses AR to identify trash and lets her earn points on a leaderboard.
Jacob is a 26-year-old student at CSU East Bay who already makes an effort to recycle and feels strongly about protecting the environment. He gets frustrated when others don’t share the same commitment and wishes recycling were easier and more accessible for everyone. For Jacob, RecycLens is appealing because it simplifies trash identification and gives him hope that gamifying the process will motivate his peers to recycle more.
.png)
.png)
.png)
.png)
.png)
I conducted a usability test using a low fidelity prototype to evaluate whether a user could successfully identify a piece of trash using the app’s AR feature. Secondary goals included checking their ability to view their rank on the leaderboard, browse trash history, and complete the login process.
Key insights from the test revealed a few areas for improvement.
→ Users had difficulty returning to the home page, which pointed to a need for clearer navigation.
→ Users expressed interest in receiving more detailed information about the type of trash they scanned.
→ Users want to know how recyclable each item was.
These findings suggest that adding educational elements and improving user flow will be essential in future iterations.
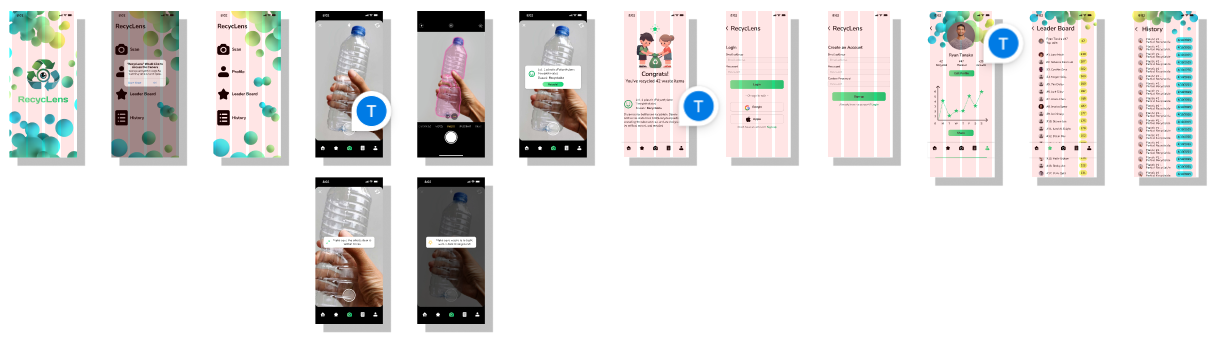
After implementing changes based on the initial test, I created a mid-fidelity design and conducted a second round of usability testing. This test included the same core tasks; using the AR feature, checking the leaderboard, viewing trash history, and logging in. The user was able to complete all tasks successfully, indicating improved usability. However, a few areas for refinement were still identified during this round.
Key insights from the second test included:
→ Instructions could be more clearly worded
→ An arrow or visual cue should indicate to click to continue on the instructions
→ A filter option is needed to track recycled trash by different time intervals
.png)
.png)
.png)
.png)
.gif)
User testing showed that participants were able to navigate the app easily and complete tasks without prompting. Feedback highlighted strong satisfaction with the overall experience, particularly the fun design and gamification features like the leaderboard. Users described the app as “easy to use” and “cool” especially when identifying recyclable materials. The scan feature and visual feedback were intuitive, though areas for improvement were noted, such as clarifying the graph on the profile page and refining login flow placement. Overall, the app's usability and engaging elements were well-received, with key takeaways pointing to the value of clear data visualization, thoughtful onboarding, and playful design.
Gamification Drives Engagement
Adding playful elements like a leaderboard and point system made a noticeable impact on user engagement. Users found the experience “fun” and were motivated to interact more with the app because of the competitive aspect. This showed us how even small gamified touches can transform mundane tasks, like recycling, into something enjoyable and rewarding.
Clarity Shapes the Experience
I learned that even well-designed features can fall short without clear instructions or visual cues. Some users were unsure about how to proceed through certain screens or interpret features like the profile graph. Clearer language, better icons, and stronger visual feedback are essential to help users feel confident and in control.
AR Connects the Physical and Digital
The AR scan feature proved effective in linking real-world actions with digital feedback. Users were able to identify trash types with ease and appreciated the instant response. However, we found that additional visual indicators like scanning animations or brackets could further enhance clarity and make the interaction feel more guided.
Provide Clear Scanning Feedback
While users successfully used the AR scan feature to identify trash, some were unsure if the app was actively scanning. Without clear feedback, the interaction felt incomplete. Adding a visual scanning indicator, such as an animation or brackets, would give users confidence that the app is working in real time and create a smoother, more intuitive experience.
Enhance Trash History with Item Details
Users appreciated having access to their trash history, but wanted the ability to explore individual entries. Currently, the history is static and non-interactive. Allowing users to tap on past items for more information, such as type, recycling category, and scan date would make the feature more engaging and informative.
Clarify Data Visualization on Profile
The graph on the profile page caused confusion, especially around the meaning of “growth.” While the goal was to show progress over time, the lack of clear labels made it unclear. Adding a title, axis labels, and a brief explanation of what “growth” represents will make the data easier to understand and more valuable to the user.